

With the fourth largest 2018-19 budget in the Atlantic 10, GW more evenly distributed its funds between men’s and women’s programs compared to its 14 conference peers.
Across the A-10, men’s squads’ head coaches earned about $216,000 per year, while female program head coaches earned $93,000 annually, according to the Equity in Athletics Data Analysis, a U.S. Department of Education database. But at GW, male program head coaches made on average about $8,000 more per year than female team head coaches – the lowest pay gap in the A-10, the data shows.
Ellen Staurowsky, a professor of sports management at Drexel, said GW’s coaching salaries were a good sign of equal funding distributions between men’s and women’s programs. But she added that the data only factors salaries and does not include financial incentives, like bonuses.
“Whatever we see in the salary base, with the EADA, that tells us something, but it doesn’t tell us about all the bonus structures,” Staurowsky said.
Here’s a breakdown of 2018-19 coaching salaries, recruiting expenses, student-athlete aid and overall athletic budgets at GW and across the A-10.
Funding distribution at GW
GW’s recruiting budget between men’s and women’s teams was more equitable than its A-10 peers, spending an average of $179,000 for men’s teams and about $172,000 for women’s teams. These expenses include transportation, lodging and meals for prospective recruits, according to the NCAA.
GW’s most profitable and highest-funded team was men’s basketball, which generated about $3.5 million on a total game-day operating budget of about $442,000. Women’s basketball followed behind with about $2.5 million in revenue on about a $290,000 game-day operating budget.
Of the 538 student-athletes rostered throughout GW’s 27 teams, 53 percent were female. Women’s teams received a total operating budget of $12.2 million compared to men’s teams’ $10.8 million. Female student-athletes were allocated $7.3 million in aid, while male student-athletes received $4.8 million.
Sidney Lee | Staff Designer
Source: Equity in Athletics data analysis
Kwame Agyemang, an associate professor of sport, business and management at Ohio State, said GW’s status as a private school and pricey location could hike its student aid percentage.
“I’m sure that plays a large part in terms of why there’s such a huge discrepancy in what you disseminate in terms of scholarships compared to other institutions, which are public schools and cheaper,” Agyemang said.
When she was named to her current position in 2018, Athletic Director Tanya Vogel said she intended to spread financial resources to all teams. Staurowsky said a school’s commitment to gender equity can be seen in funding distribution.
“A lot of schools have rhetoric around that,” Staurowsky said. “But there are some schools, you can really see that playing out. And there are a few schools, where in their financial-like allocations, you can see where that gender equity principle is very strong.”
Salary equity throughout the A-10
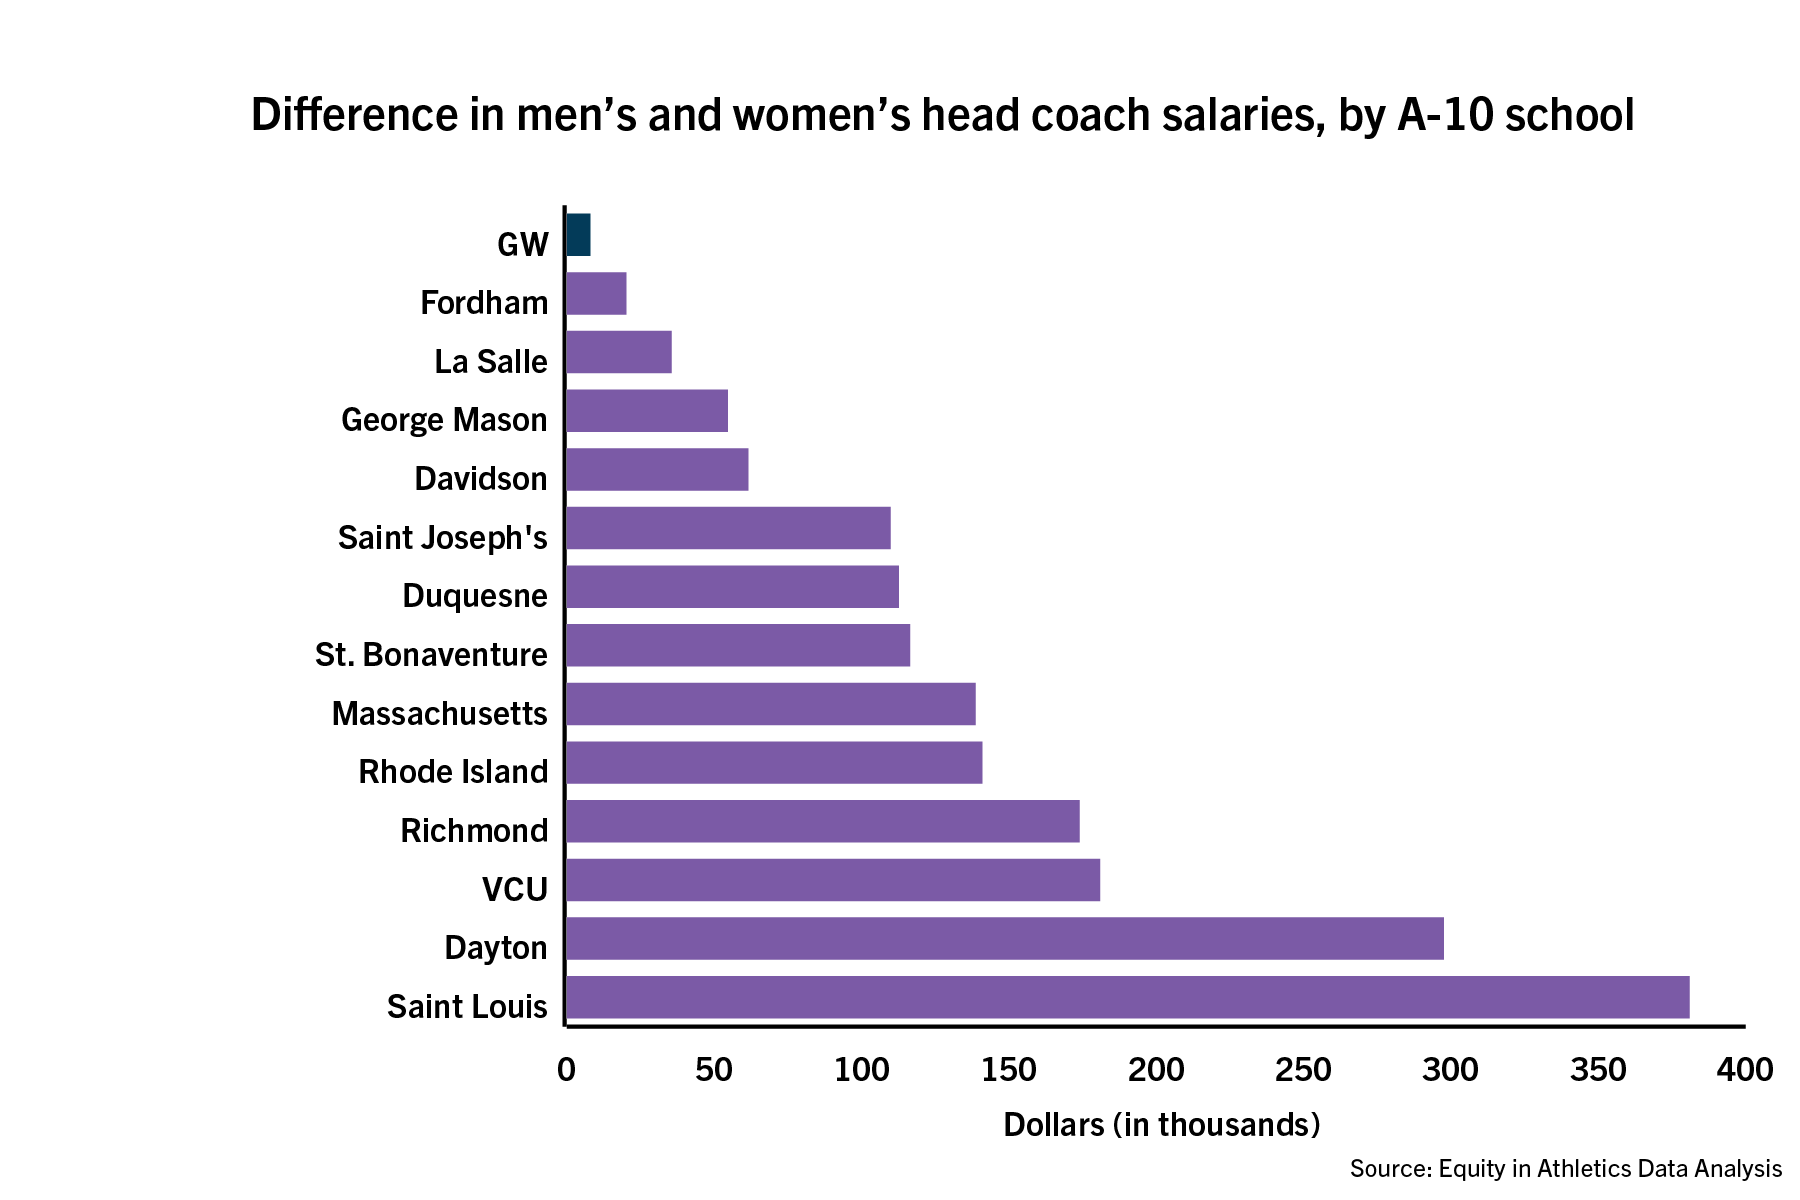
The average pay gap between men and women’s teams’ head coaching salaries across the A-10 was $123,000, but GW’s average gap stood at $8,000.
Saint Louis and Dayton held the largest disparity in pay between male and female coaches. At Saint Louis, the average male head coach made $472,000, while the average female head coach was paid $91,000. Dayton held a $190,000 difference between male and female coaching salaries.
Sidney Lee | Staff Designer
Source: Equity in Athletics data analysis
David Ridpath, an associate professor of sports management at Ohio University, said salaries can become artificially inflated because they are set by each respective athletic department. Ridpath added that coaching salaries have “essentially skyrocketed” since the NCAA does not cap the salary.
“At the end of the day, those earnings are capped and restricted for the players, so thus there’s not the standard economic effects of supply and demand, budgeting, those kinds of things,” Ridpath said.
Massachusetts took the cake for the highest paying average women’s team head coach salary with just more than $127,000 per year. VCU, Fordham, Richmond and Dayton rounded out the top-five, each allotting more than $100,000 per year to the helms of its women’s teams.
La Salle had the lowest paid men’s and women’s team head coaches, paying an average of about $83,000 on the men’s side and $47,400 on the women’s side.
Recruiting, revenue and aid in the A-10
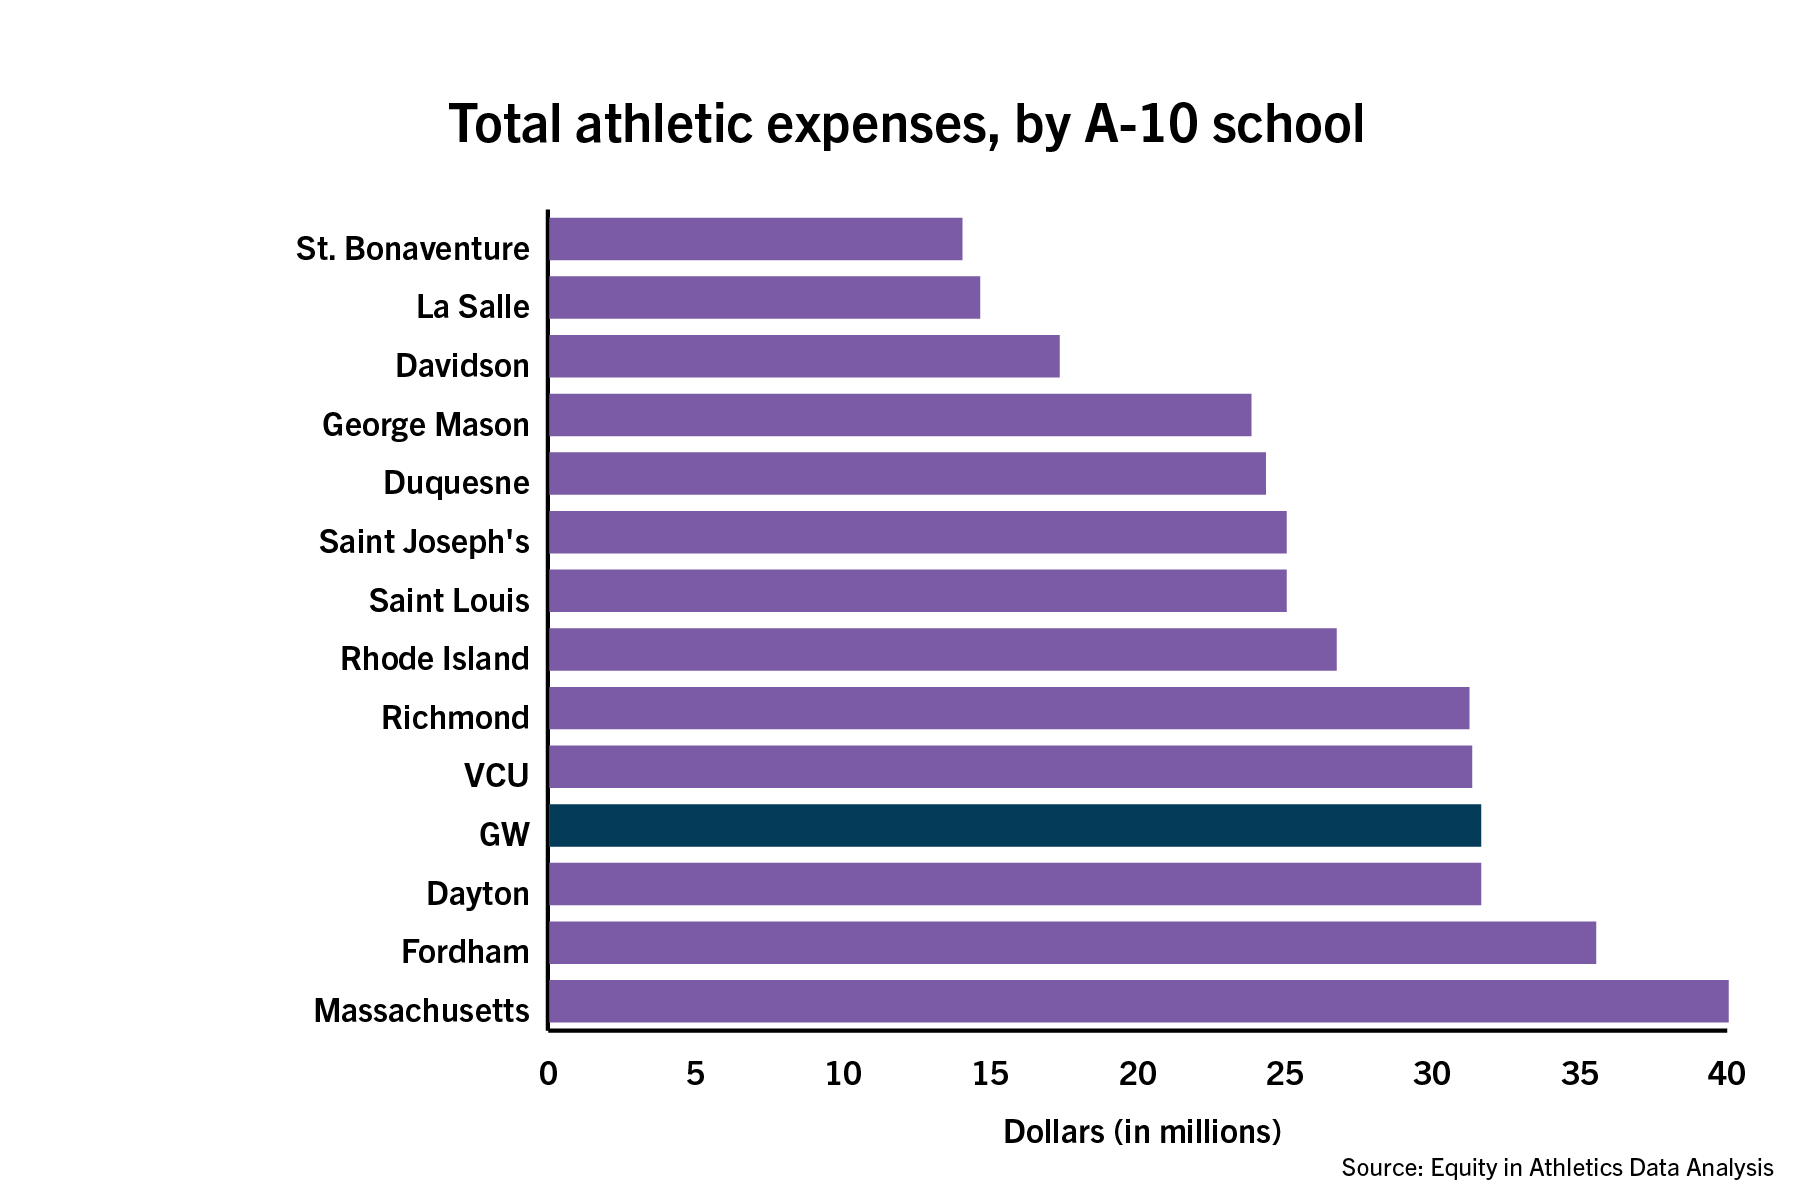
Schools across the A-10 vary in its makeup and funding distribution. Operating budgets swelled to $40 million at Massachusetts and deflated to $14 million at St. Bonaventure. GW held the fourth largest budget for the 2018-19 season at $31 million.
Despite the variations, most A-10 schools didn’t turn a profit from its athletic programs. Davidson, Dayton, La Salle, Richmond, VCU and Rhode Island did generate profits ranging from about $275,000 to $3.4 million. GW and the remaining seven other universities broke even last year.
Massachusetts had the largest recruiting budget on the men’s and women’s side, allotting nearly $780,000 and $282,000, respectively. Saint Joseph’s claimed the lowest recruiting expenses at about $130,000 on the men’s side and St. Bonaventure dished out the lowest recruiting expenses on the women’s side at $79,000.
On average, the A-10 spent $314,000 on men’s teams’ recruiting expenses and $178,000 on women’s teams. GW was on par with women’s recruiting expenses but trailed by about $135,000 in men’s recruiting expenses. Still, the athletic department was the most equitable university in recruiting funding overall.
Sidney Lee | Staff Designer
Source: Equity in Athletics data analysis
Andrew Zimbalist, a professor of economics at Smith College, said that while Title IX requirements are vague around pay equity, they are well-defined in areas like recruiting expenses, division of facilities and scholarships.
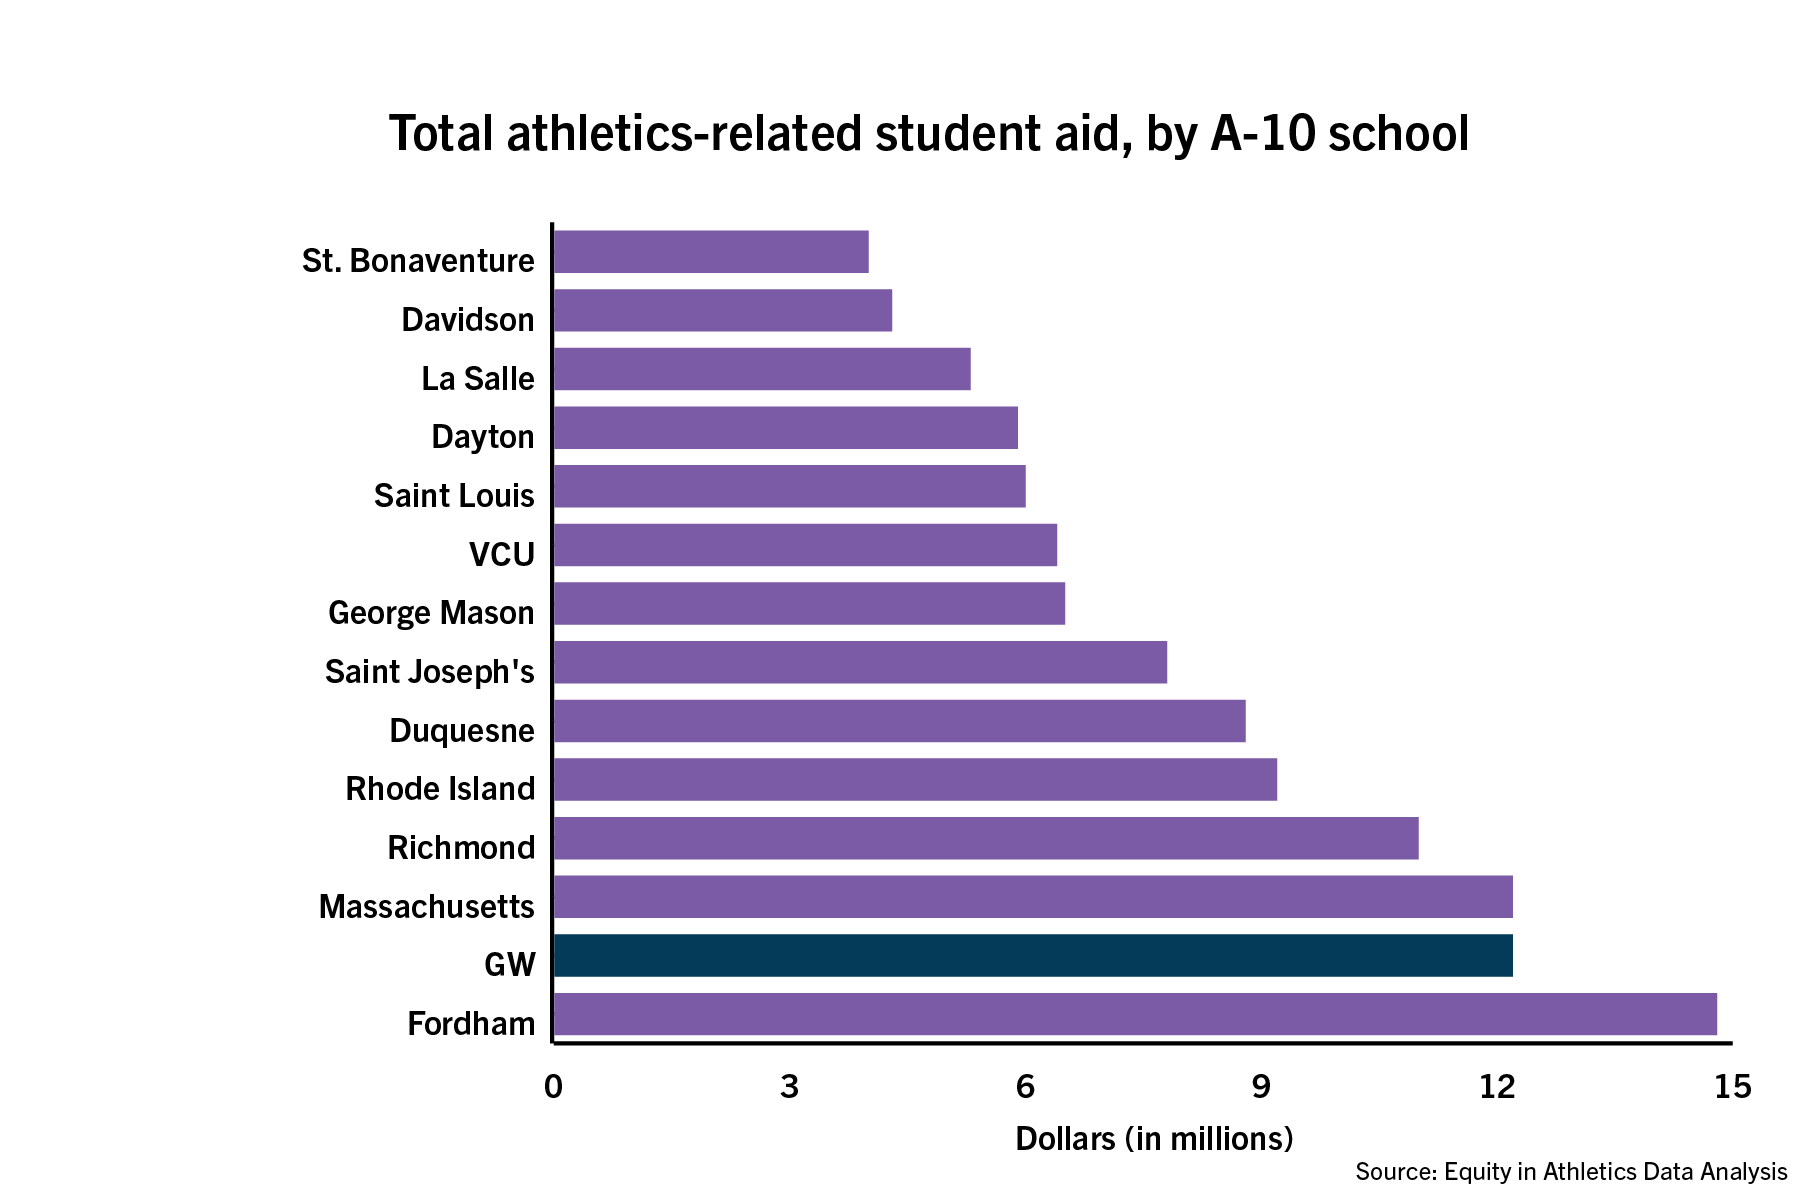
GW’s student-athlete financial aid packages, which totaled more than $12 million, represented 38 percent of its entire athletics operating expenses, the second highest in the conference behind Fordham, which shelled out about $14.7 million in aid.
GW joined six other A-10 schools that allotted more athletically-related student aid to women’s teams. Davidson spread its student-athlete aid the most evenly among men’s and women’s teams with about a $242,000 disparity.
“Very few universities are in compliance strictly with the various regulations,” Zimbalist said. “It sounds like GW has made an effort to comply, and that’s wonderful.”
Roman Bobek and Rohan Kandeshwarath contributed reporting.


